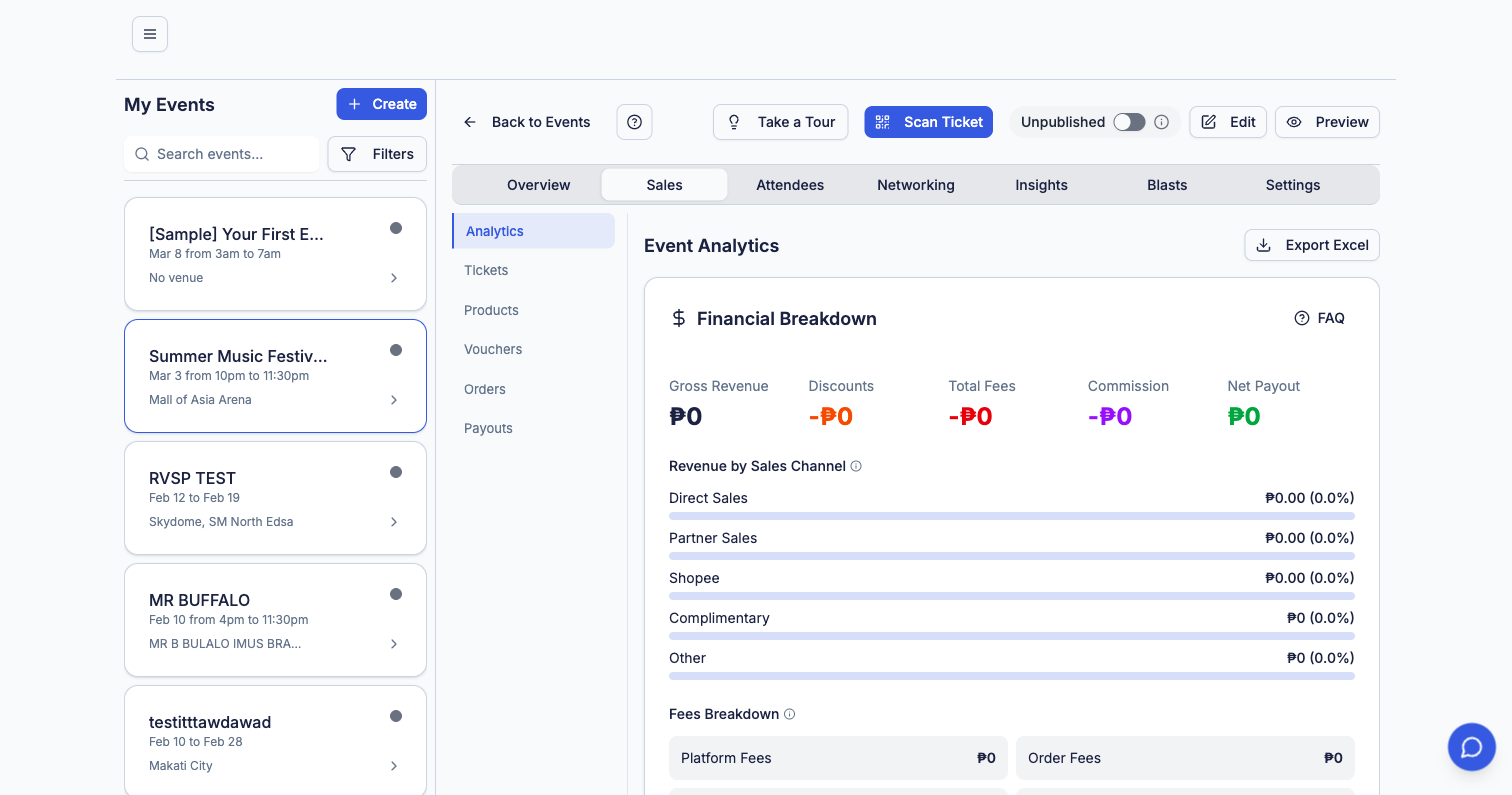
Charts and numbers showing ticket sales over time, total revenue, sales by ticket type, and conversion rates. Track progress during the sales period and review results after the event wraps up.
Understand who’s attending: breakdowns by age group, gender, location (city/region), and device used to purchase. Knowing your audience helps you plan better events and target your marketing.
See where your ticket buyers came from: social media, search engines, direct visits, email campaigns, affiliate links, or referral sites. This tells you where to spend your marketing budget next time.
Understand why visitors aren’t buying. See how people interact with your event page — how many visited, how long they stayed, what they clicked, and where they dropped off in the buying process.
For organizers running a series: combined analytics across all events in a group. Total revenue, total attendance, trends over time, and comparisons between individual events.